On this page

Fixing sampling bias starts with the frame, not the formula: rebuild or extend the sampling frame and recruitment path first, since that’s the only fix that reaches unmeasured groups. When frame changes aren’t feasible, targeted oversampling or new data collection ranks next, followed by resampling (which tends to outperform reweighting for models trained with stochastic gradient descent) and reweighting, which corrects only for the variables you actually measured. Every fix, in every order, needs verification through sensitivity analysis before anyone trusts the result.
TL;DR:
- Rebuilding or expanding the sampling frame is the most durable way to address undercoverage and reach unmeasured groups directly.
- When frame updates are not feasible, targeted oversampling and thorough sensitivity analyses help assess the residual bias and guide appropriate corrections.
- Using probability sampling methods and planned oversampling of small, important subgroups reduces the risk of bias before data collection begins.
- Reweighting only adjusts for measured variables, making it ineffective against biases from unmeasured factors or nonresponse patterns.
- Continuous verification through sensitivity analysis, reporting, and process governance prevents biases from persisting or re-emerging in the data.
Table of Contents
- What Is Sampling Bias and Why Does It Undermine Validity?
- What Are the Common Types and Causes of Sampling Bias?
- How Do You Diagnose Sampling Bias Before Fixing It?
- Which Fixes Actually Reduce Sampling Bias?
- When Do Sampling Bias Fixes Fail or Backfire?
- How Do You Verify a Sampling Bias Fix Actually Worked?
- How Has Glitchive Documented Sampling and Frame Failures?
- Why Governance, Not Just Technique, Prevents Repeat Sampling Failures
- Where to Find Documented Fixes and Applied Runbooks
- Sources
- FAQ
What Is Sampling Bias and Why Does It Undermine Validity?
Sampling bias occurs when the process used to select a sample systematically favors some members of the target population over others, so the sample no longer represents the group you’re trying to describe or model. This is different from random sampling error, which shrinks as sample size grows. Sampling bias doesn’t shrink. A larger sample pulled through the same flawed process just gives you a more precise estimate of the wrong number. That distinction is the core insight from CASRAI’s guidance on sampling bias: precision and accuracy are separate problems, and no amount of additional rows fixes a biased collection process.
External validity, the ability to generalize findings beyond the sample, depends entirely on how closely the sample mirrors the target population. A model or survey can perform beautifully on its own data and still fail the moment it meets the real world, because the real world was never represented in training or fielding.
Two quick illustrations, both hypothetical:
- A customer satisfaction survey emailed only to app users with active accounts overrepresents engaged users and misses churned customers entirely, inflating the apparent satisfaction score.
- An image classifier trained mostly on daytime photos will show strong validation accuracy but degrade sharply on nighttime images, because the sampling frame for training data never included that condition.
Neither problem gets fixed by collecting more emails or more daytime photos. Both require rethinking who or what got into the sample in the first place.
What Are the Common Types and Causes of Sampling Bias?
Sampling bias shows up in a handful of recognizable patterns, and each one traces back to a specific operational misstep. Recognizing the pattern is the fastest way to guess the cause before you even start digging into the data. The examples below are illustrative, not documented incidents.
- Undercoverage happens when the sampling frame itself excludes part of the target population, such as a phone survey that only dials landlines and never reaches mobile-only households.
- Self-selection bias occurs when participants opt into a sample based on traits that correlate with the outcome, like an online product review skewing positive because only highly satisfied or highly frustrated customers bother to write one.
- Nonresponse bias appears when invited participants systematically decline, often because the questions, timing, or mode of contact discourage certain groups, such as low-income respondents skipping a mailed survey requiring postage and time.
- Survivorship bias creeps in when the sample only includes cases that “survived” some filtering process, like evaluating a trading strategy using only funds still operating today and ignoring the ones that failed and shut down.
- Recall bias distorts retrospective data when participants misremember past events differently depending on their current state, a common problem in health surveys asking patients to recall diet from years earlier.
- Observer bias enters when the person or system recording data unconsciously favors certain outcomes, such as an annotator labeling ambiguous images differently depending on prior expectations about the dataset.
Frame errors, restrictive recruitment channels, physical or digital access barriers, and mismatched incentives are the four operational roots behind nearly all of these patterns. Fix the root cause, not just the symptom, and the bias type usually resolves with it.
How Do You Diagnose Sampling Bias Before Fixing It?
Diagnosis has to happen before mitigation, because the wrong fix applied to the wrong problem can make results look more trustworthy while staying just as wrong. Run these checks in order.
Start with a frame gap analysis. Write down the target population in specific, operational terms (age range, geography, account status, device type), then compare it line by line against the actual sampling frame you drew from. Any group present in the target population but absent, or nearly absent, from the frame is an undercoverage problem no amount of statistical adjustment can touch. Health survey methodology guidance treats this frame comparison as the first and most important diagnostic step, ahead of any weighting or modeling decision.

Benchmark the sample against an external reference. Census figures, administrative records, or platform-level usage logs give you an outside anchor. If your survey sample has a much higher proportion of college-educated respondents compared to the census data for the target region, you have a measurable, quantifiable coverage gap rather than a vague suspicion.
Assess the missingness mechanism. Missing data generally falls into three buckets: missing completely at random (MCAR), missing at random conditional on observed variables (MAR), or missing not at random (MNAR), where the missingness itself correlates with the unobserved outcome. MNAR is the dangerous one, since it’s exactly the pattern that makes standard weighting unreliable. A short follow-up survey to a random subset of nonresponders, even a five-question phone call to twenty people who ignored the main instrument, often reveals whether their answers would have skewed the results.
Compute subgroup cell counts and effective sample size. Break the sample into the demographic or feature cells that matter for your analysis and count how many observations land in each one. Small cells produce unstable estimates regardless of the total sample size.
Statistic callout: Practitioners working with post-stratification weighting are advised to flag any critical cell where effective sample size drops below roughly 30, since weighting corrections lose reliability under exactly that condition, and targeted re-collection becomes the safer move.
For machine learning pipelines, the diagnostic list extends further, as detailed in the AI Learning Center. Check label coverage across subgroups, not just overall class balance. Measure distributional drift between training data and the deployment population using whatever drift metric your monitoring stack supports. Most critically, measure subgroup performance gaps directly rather than trusting an aggregate accuracy score, because a model can post excellent overall metrics while failing badly on an underrepresented slice that never showed up in meaningful numbers during training or validation.
- Confirm target population definition matches sampling frame documentation.
- Benchmark sample demographics against census or administrative data.
- Classify missingness as MCAR, MAR, or MNAR using follow-up checks.
- Calculate effective sample size per subgroup cell.
- For ML datasets, check label coverage and subgroup validation performance separately from aggregate metrics.
Skip any of these and a mitigation choice becomes a guess dressed up as a correction.
Which Fixes Actually Reduce Sampling Bias?
Once diagnosis identifies where the sample departs from the target population, the fix should match the mechanism, not just the symptom. Here’s the order that works in practice, from most durable to most limited.
- Fix the frame and recruitment path first. If your sampling frame excludes a group entirely, no downstream statistic reaches them. Update the list, add a second recruitment mode (phone plus web plus in-person), offer an incentive sized to the burden of participating, and specifically follow up with initial nonresponders using a different contact method than the first attempt.
- Use probability sampling when you’re building the frame fresh. Simple random sampling works when the population is fairly homogeneous. Stratified random sampling, drawing separately from predefined subgroups, works better when you need guaranteed representation of small but important segments, such as a rare disease cohort or a minority language group. Cluster sampling suits geographically dispersed populations where visiting every individual site is impractical. Probability-based designs remain the gold standard precisely because every population member has a known, non-zero chance of selection.
- Apply planned oversampling for known small subgroups. If you know in advance that a subgroup will be rare (say, 3% of the population but critical to your analysis), deliberately oversample it during collection, then apply post-stratification weights afterward to bring the analysis back in line with true population proportions.
- Reweight, but only for measured variables. Post-stratification, raking, and propensity weighting all adjust your sample so its marginal distributions on known variables (age, region, income bracket) match external benchmarks. The catch, and it’s a real one: weighting only ever corrects for differences on variables included in the weighting scheme. If the group you’re missing differs in some way you didn’t measure, weighting does nothing for that gap and can create false confidence that the problem is solved.
- Resample or apply synthetic augmentation for ML training data. Oversampling the minority class (duplicating or augmenting examples) or undersampling the majority class rebalances a training set directly, rather than adjusting loss weights after the fact.
Pro Tip: Before committing to reweighting for a model trained with stochastic gradient descent, run two identical training jobs side by side, one with a reweighted loss function and one with a resampled dataset, changing nothing else. Optimizer interactions with reweighted losses can make training numerically less stable than resampling, so comparing subgroup validation performance and convergence behavior directly tells you which approach actually holds up for your specific architecture rather than which one sounds more principled on paper.
Whichever fix you choose, check effective sample size afterward and trim any weight that’s grown extreme, since a handful of observations carrying disproportionate weight can single-handedly swing an estimate. Document the trimming threshold you used. If you’re resampling, monitor whether duplicated minority examples are causing overfitting on those specific rows rather than genuine generalization.
When Do Sampling Bias Fixes Fail or Backfire?
Every fix above has a breaking point, and pretending otherwise is how teams end up trusting a corrected number that’s still wrong.
Extreme weights are the most common failure mode in survey work. When a small number of respondents in an undercovered cell get assigned very high weights to compensate for their scarcity, those few responses start driving the entire estimate. Variance balloons, confidence intervals widen even as the point estimate looks more “corrected,” and a single outlier respondent can move a national statistic more than it reasonably should.
Statistic callout: Analysts working with post-stratification weights are generally advised to inspect the weight distribution for extreme values and consider re-collection over aggressive weighting whenever a critical cell’s effective sample size falls too low to support stable estimation, rather than pushing the weighting scheme further to compensate.
For machine learning specifically, the optimizer matters as much as the data. Reweighting a loss function assumes the optimizer will respond to those weights the way the math implies, but stochastic gradient descent doesn’t always behave that cleanly, and resampling frequently produces more stable subgroup performance in practice. Treating the dataset, the model, and the optimizer as a single interacting system, rather than fixing the data and hoping the rest follows, is the more defensible engineering posture.
Unmeasured confounders are the fix that weighting simply cannot reach. If nonresponders differ from responders in some trait nobody recorded, no weighting scheme, however clever, can adjust for it. That’s a structural limit, not an implementation mistake.
Deciding between collecting new data and applying an analytic fix comes down to cost, timeline, and how much the downstream decision matters. A quick internal product survey with a mild skew might tolerate reweighting. A clinical trial or a hiring algorithm affecting real people generally does not, and the safer move is targeted re-collection even when it costs more.
How Do You Verify a Sampling Bias Fix Actually Worked?
Verification is the step most analyses skip, and it’s the one that separates a documented fix from a hopeful one.
Run sensitivity analyses under a handful of plausible MNAR scenarios: what would the estimate look like if the nonresponders were 20% less satisfied than responders? What if they were 20% more? Presenting a range under different missingness assumptions, rather than a single corrected point estimate, gives readers an honest picture of how much the conclusion depends on data you never actually collected.
Where possible, pre-register the robustness checks you plan to run before seeing the corrected results, and hold back a split sample specifically for retesting key estimates once the main fix is applied.
Reporting should include, at minimum:
- The sampling frame used and how it compared to the target population.
- Recruitment steps, including any follow-up contact with initial nonresponders.
- The response rate and a description of likely missing or underrepresented segments.
- The weighting algorithm or resampling method applied, with the effective sample size before and after.
| Reporting item | Why it matters |
|---|---|
| Sampling frame description | Lets readers judge undercoverage risk directly |
| Response rate | Signals potential nonresponse bias magnitude |
| Weighting or resampling method | Shows exactly what was corrected and how |
| Effective sample size (before/after) | Flags unstable estimates from extreme weights |
| Sensitivity analysis range | Documents residual bias under plausible scenarios |
A minimal verification runbook worth copying into any project template: benchmark against external population metrics, compute effective sample size and inspect the weight distribution, run sensitivity checks under plausible MNAR assumptions, retest key estimates on a targeted re-collected subsample, and publish the methods and assumptions alongside the results.
How Has Glitchive Documented Sampling and Frame Failures?
Glitchive’s case library exists specifically to trace how a flawed dataset or sampling decision turned into a downstream failure, and what teams actually did to fix it. One documented case shows a support chatbot that invented a refund policy, a failure rooted partly in training and evaluation data that never adequately covered edge-case customer queries, leaving a coverage gap the model tried to paper over with fabricated confidence.
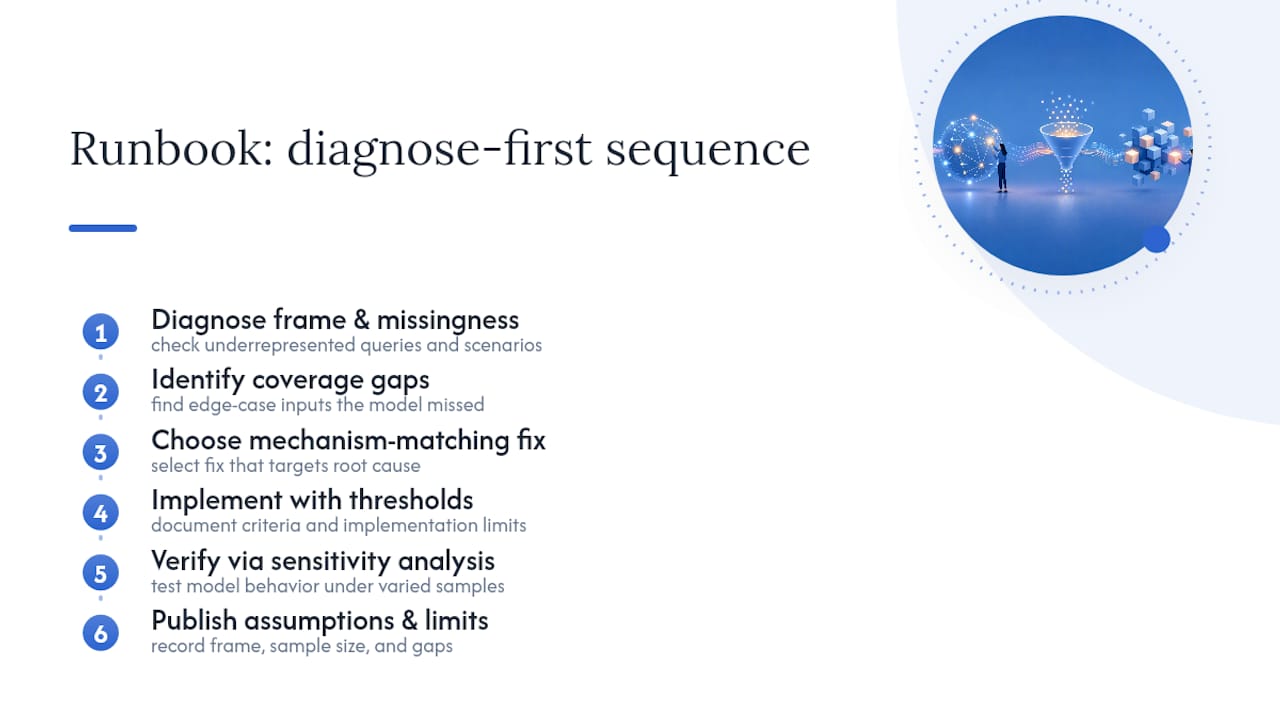
Teams working through these incidents typically diagnosed the coverage gap first, checking what kinds of queries or scenarios were underrepresented in the data the system was evaluated against, before applying any fix. That diagnose-first sequence matters more than which specific fix got chosen afterward.
A one-page runbook worth keeping on hand: diagnose the frame and missingness, choose the fix that matches the mechanism (not the symptom), implement it with documented thresholds, verify with sensitivity analysis, and publish the assumptions.
Pro Tip: When a case record is silent on sample size or frame details, treat that as a limitation rather than filling the gap with assumption. Glitchive’s methodology flags exactly this kind of gap rather than guessing at unreported specifics, and your own documentation should do the same.
Why Governance, Not Just Technique, Prevents Repeat Sampling Failures
Technique alone doesn’t stop sampling bias from recurring; process does. A sampling review gate before data collection begins, requiring a written frame gap analysis before anyone touches a model or survey instrument, catches most undercoverage problems before they’re expensive to fix.
Pre-registration of the sensitivity checks you’ll run forces honesty about assumptions before results can bias the analysis plan. In production ML systems, ongoing monitoring of subgroup coverage, not just aggregate accuracy, catches drift before it becomes a customer-facing failure. When something does slip through, logging it as a full incident, with the frame gap, the fix attempted, and the verification result, turns one mistake into training material for the next team. That’s the same discipline behind every case in Glitchive’s library: a documented failure is worth more than an undocumented success.
— GH
Where to Find Documented Fixes and Applied Runbooks
Every fix described here reads differently on paper than it does inside a real system that shipped a bad output. Glitchive’s repository of verified AI failure cases exists to close that gap, documenting the incident, the contributing factors, and the specific remediation applied, with sourced references and permanent citable URLs for every entry.
For engineers dealing with a production sampling or data coverage problem right now, the coding agent incident involving a wiped production database shows the same diagnose-then-fix structure applied to a different failure class, useful as a template for forensic write-ups. The full case library is searchable by failure type, and the corrections page tracks updates when new evidence changes a documented conclusion. Start with a case close to your own stack, read the fix, and check whether the same diagnostic sequence applies to your dataset before you commit to a mitigation.
Sources
For methodology depth beyond this guide: the NCBI health survey design guide covers probability sampling in full. The arXiv analysis of resampling versus reweighting under SGD covers the optimizer interaction. PMC’s review of weighting limits and NCBI’s missing data guidance cover reweighting trade-offs and sensitivity analysis. CASRAI’s sampling bias guide covers definitions and reporting standards.
- Designing and Conducting Health Surveys: A Comprehensive Guide
- Why resampling beats reweighting for SGD-trained models (An, Ying, Zhu, 2020)
- Limits of weighting corrections for survey nonresponse
FAQ
What Does Sampling Bias Mean in Practice?
Sampling bias means the process used to collect a sample systematically favors certain members of the target population over others, so the resulting data misrepresents the group being studied regardless of how large the sample grows.
What Are the Best Strategies for Overcoming Sampling Bias?
Fix the sampling frame and recruitment path first, use probability sampling or planned oversampling when building the sample, apply reweighting only for measured variables, and always verify the result with a sensitivity analysis, since weighting alone cannot correct unmeasured differences.
What Can Be Done to Reduce Sampling Error Specifically?
Sampling error, unlike sampling bias, shrinks with a larger, well-drawn probability sample; increasing sample size through the same unbiased frame reduces error, while increasing sample size through a biased frame only increases false precision.
How Do You Reduce the Impact of Bias in Machine Learning Datasets?
Diagnose subgroup coverage gaps and label imbalance first, then compare resampling against reweighting through paired training runs, since resampling often produces more stable subgroup performance than reweighting under stochastic gradient descent.
Can You Fully Eliminate Sampling Bias With Statistical Fixes Alone?
No single statistical fix eliminates sampling bias completely; reweighting and resampling reduce bias tied to measured variables, but unmeasured confounders and MNAR missingness require sensitivity analysis and, often, targeted new data collection to properly document and bound.