On this page

ML failure analysis is an engineering workflow that converts an observed symptom into a verified root cause using reproducible evidence and domain-aware experiments. The goal is not just to explain what went wrong, but to produce enough evidence to confirm the cause, apply a fix, and verify that the fix actually works without introducing new problems.
The canonical workflow runs in this order:
- Symptom: Observe and document the failure signal (metric drop, wrong output, crash, drift alert)
- Scope: Bound the incident (which model, pipeline stage, data slice, time window, environment)
- Data/system triage: Audit inputs, labels, features, infrastructure, and recent deployments
- Causal hypotheses: Generate ranked hypotheses from the taxonomy (intentional vs. unintentional)
- Evidence collection: Gather logs, predictions, feature distributions, and metadata
- Reproduction: Build a minimal, deterministic test case that reliably triggers the failure
- Contributing factors: Identify all conditions that enabled the failure, not just the proximate cause
- Corrective action: Apply a targeted fix (data patch, retrain, input sanitization, rollback)
- Verification: Confirm the fix resolves the failure and run regression tests to check for side effects
- Documentation: Write a postmortem with evidence, timeline, fix, and prevention steps
Three foundational references anchor this workflow: the Microsoft failure-modes taxonomy, which classifies both intentional and unintentional failures and maps adversarial cases to CIA impacts; ProbeLLM, an automated probing framework that uses hierarchical Monte Carlo Tree Search to discover and characterize failure modes at scale; and Errudite, an ACL-published tool that applies precise group definitions and counterfactual rewrites to make error analysis reproducible.
Key Takeaways
Effective ML failure analysis requires a repeatable engineering workflow, a shared taxonomy, and cross-disciplinary ownership — not just model diagnostics.
| Point | Details |
|---|---|
| Start with the taxonomy | Classify every failure as intentional or unintentional first; it determines your evidence strategy and escalation path. |
| Build a minimal reproduction case | A deterministic, minimal test case is the single most important artifact in any failure investigation. |
| Use cohort analysis, not aggregate metrics | Error trees surface concentrated failure subgroups that overall accuracy scores will never reveal. |
| Estimate fix impact before retraining | A model-driven RCA using dataset meta-features can predict post-repair performance with mean intervention error around 0.036, saving compute on uncertain fixes. |
| Glitchive as a reference library | Glitchive’s verified case studies let teams compare failure patterns and remediation approaches against documented, sourced incidents. |
Table of Contents
- How do ML failure modes break down into a usable taxonomy?
- What intentional failure modes should you check first in a triage?
- What unintentional failure modes cause the most production incidents?
- How do you run a repeatable failure-analysis workflow from symptom to verified cause?
- Which diagnostic methods work best for finding ML failure causes?
- What mitigations and validation patterns should follow a confirmed root cause?
- What supply-chain and compliance risks should U.S. teams check during analysis?
- Why failure analysis is a cross-disciplinary problem, not a data science task
- Glitchive gives your team a verified failure library to work from
- Sources
- FAQ
How do ML failure modes break down into a usable taxonomy?
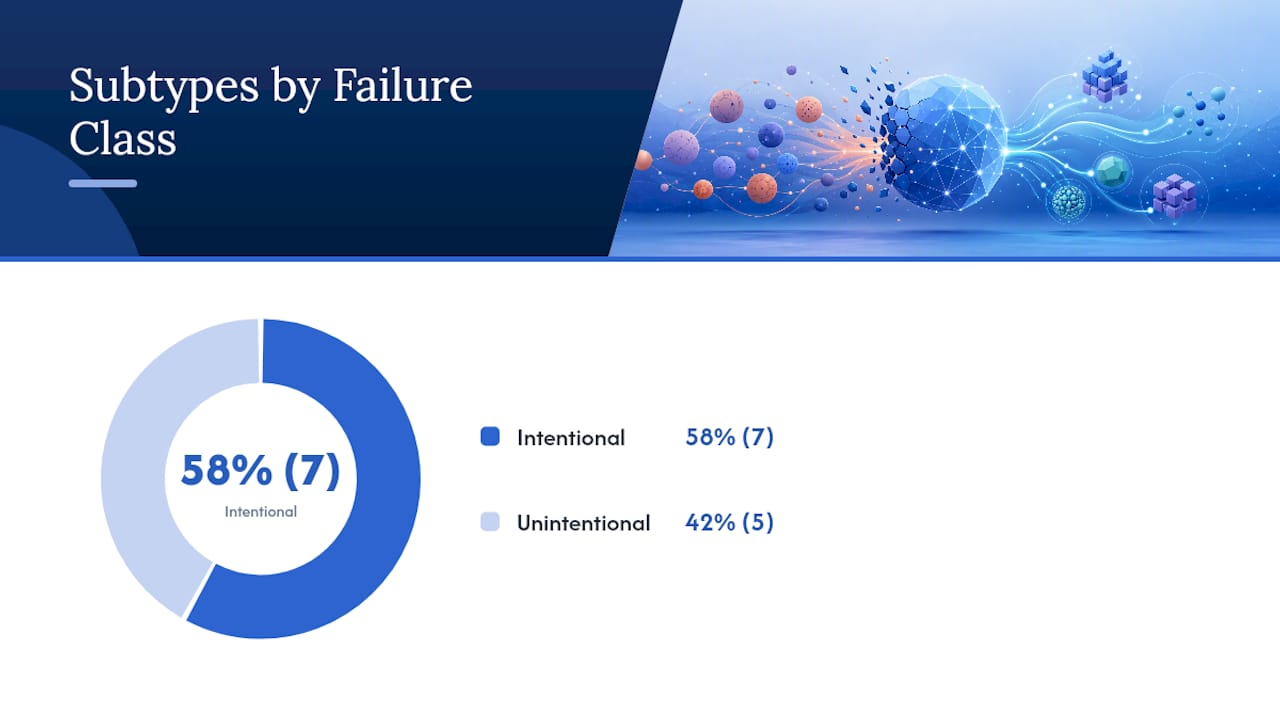
Every ML failure belongs to one of two top-level classes: intentional and unintentional. That split is not academic. It determines your evidence-collection strategy, your escalation path, and whether you need to involve security teams.
Intentional failures are deliberate attacks on a model’s behavior. Someone is actively trying to manipulate inputs, corrupt training data, extract private information, or steal the model itself. Unintentional failures arise from engineering gaps: distributional shift, incomplete testing, reward misspecification, or corrupted data pipelines with no malicious actor involved.
For intentional failures, the Microsoft failure-modes taxonomy applies a CIA lens borrowed from information security:
- Confidentiality: Attacks that extract private training data or model internals (membership inference, model inversion)
- Integrity: Attacks that corrupt model behavior or outputs (adversarial examples, poisoning, backdoors)
- Availability: Attacks that degrade or deny the model’s useful function (denial-of-service via adversarial inputs, model stealing that undermines competitive availability)
Microsoft assembled this combined taxonomy after noting that more than 200 papers on adversarial ML had been published in recent years, and used it to drive internal SDLC changes. That volume of literature is exactly why a standardized taxonomy matters: without one, teams reinvent triage criteria for every incident.
Taxonomy at a glance:
| Class | Subclass | One-line definition |
|---|---|---|
| Intentional | Adversarial/perturbation | Crafted inputs that force misclassification |
| Intentional | Poisoning | Corrupted training data that shifts model behavior |
| Intentional | Backdoor | Hidden trigger that activates malicious behavior |
| Intentional | Model inversion | Reconstructing training data from model outputs |
| Intentional | Membership inference | Determining whether a record was in training data |
| Intentional | Model stealing | Replicating a model via query access |
| Intentional | Supply-chain tampering | Compromised weights, dependencies, or artifacts |
| Unintentional | Distributional shift | Production inputs differ from training distribution |
| Unintentional | Incomplete testing | Failure modes not covered by the test suite |
| Unintentional | Reward hacking | Model optimizes proxy metric, not true objective |
| Unintentional | Natural adversarial examples | Rare real-world inputs that cause misclassification |
| Unintentional | Common corruptions | Noise, blur, compression artifacts in real inputs |
ProbeLLM’s failure-aware embeddings and clustering approach can synthesize discovered failures into these structured modes automatically, which is useful when you have hundreds of failure cases and need to group them without manual labeling.
What intentional failure modes should you check first in a triage?
Intentional failures tend to leave different forensic traces than bugs do. A sudden, narrow performance collapse on a specific input pattern, outputs that are confidently wrong in a systematic direction, or model behavior that changes only under a precise trigger condition — these are signals worth treating as adversarial until proven otherwise.
The key forensic question for intentional failures is not “what broke?” but “who benefits from this behavior, and could it have been engineered?” A model that consistently misclassifies one competitor’s product as low-quality, or that leaks training-set membership on targeted queries, did not arrive at that behavior by accident. Treat systematic, directional errors as intentional until the evidence rules it out.
Named intentional failure modes to check during triage:
-
Perturbation/adversarial examples: Small, often imperceptible input modifications that flip model predictions. Illustrative example: a stop-sign image with a printed sticker causes a vision model to classify it as a speed-limit sign. CIA impact: Integrity. Detection signal: high-confidence wrong predictions on inputs that look normal to humans.
-
Poisoning: Malicious samples injected into training data to shift decision boundaries. Illustrative example: spam emails labeled “not spam” are inserted into a training corpus, gradually degrading the filter. CIA impact: Integrity. Detection signal: gradual drift in a specific output class after a data pipeline update.
-
Backdoors: A hidden trigger embedded during training that activates a specific behavior when present. Illustrative example: a model trained on a dataset containing a watermark pattern always predicts a target class when that watermark appears. CIA impact: Integrity. Detection signal: near-perfect accuracy on clean inputs but anomalous behavior on a narrow trigger pattern.
-
Model inversion: Querying a model repeatedly to reconstruct approximate training samples. CIA impact: Confidentiality. Detection signal: high query volume from a single source with systematic input variation.
-
Membership inference: Determining whether a specific record was used in training, often by observing prediction confidence. CIA impact: Confidentiality. Detection signal: confidence scores that are systematically higher on suspected training records.
-
Model stealing: Replicating model behavior by querying it at scale and training a surrogate. CIA impact: Availability and Confidentiality. Detection signal: unusually high and structured API query volumes.
-
Supply-chain tampering: Compromised model weights, malicious dependencies, or poisoned pre-trained checkpoints downloaded from a public repository. CIA impact: All three. Detection signal: unexpected behavior after a dependency update or model download; hash mismatch on artifacts.
The common thread across all intentional modes is systematic directionality. Random bugs produce scattered errors; attacks produce concentrated, directional ones. That distinction is your first triage filter.
What unintentional failure modes cause the most production incidents?
Most production failures are not attacks. They are the predictable result of a model meeting a world it was not trained on, or a test suite that never covered the edge cases that matter.
Distributional shift is the most common culprit. The production input distribution drifts from the training distribution, and model performance degrades silently until a metric threshold triggers an alert — or a user complaint does. Shift can be covariate (input features change), label (outcome rates change), or concept (the relationship between inputs and labels changes). Each type points to a different fix.
Incomplete testing is the second most common root cause. A model passes all unit and integration tests, ships, and fails on a real-world cohort that was never represented in the test suite. This is not a model problem; it is a coverage problem.
Reward hacking appears in reinforcement learning and in any system where a proxy metric substitutes for the true objective. The model finds a shortcut that maximizes the proxy without achieving the goal. Illustrative example: a content-ranking model trained to maximize engagement time learns to surface outrage-inducing content because it holds attention, not because it is useful.
Natural adversarial examples are real inputs, not crafted attacks, that happen to fall near a decision boundary and cause misclassification. They occur without any attacker. Detection requires systematic coverage testing across rare input subgroups.
Common corruptions include image noise, audio distortion, text with typos, and compression artifacts. Models trained on clean data often fail badly on corrupted inputs even when the corruption is mild.
Operational detection signals to watch:
- Metric drift on a rolling evaluation window (accuracy, F1, calibration error)
- Cohort regressions: aggregate metrics look stable, but a specific slice degrades
- New error clusters in embedding space that did not exist at launch
- Feature distribution skew detected by a data-quality monitor
- Sudden spike in low-confidence predictions or abstentions
Quick triage to separate data/pipeline issues from model-internal failures:
- Run the model on a frozen held-out set from training time. If performance is unchanged, the model is fine and the issue is in the data pipeline or input distribution.
- Check feature distributions against a training-time baseline. A shift in any high-importance feature is a strong signal of distributional shift.
- Inspect recent data pipeline changes, schema updates, or upstream data-source changes.
- If the model degrades on the frozen set too, the failure is model-internal: retrain, fine-tune, or patch.
How do you run a repeatable failure-analysis workflow from symptom to verified cause?
The workflow below is designed to be followed during an active incident. It is a runbook, not a retrospective framework.
Incident runbook: ML failure analysis checklist
Phase 1: Symptom and scope
- Document the failure signal: which metric, which endpoint, which time window, which user cohort
- Confirm the failure is reproducible (not a transient infrastructure event)
- Identify the model version, training data version, and pipeline version active at failure time
- Bound the blast radius: is the failure isolated to one model, one pipeline stage, or one data slice?
Phase 2: Data, model, system, and human factors
- Pull prediction logs for the failure window and compare to a baseline window
- Check data pipeline integrity: schema validation, null rates, distribution statistics
- Review recent deployments, configuration changes, and dependency updates
- Identify human factors: was there a labeling change, a feature engineering update, or a policy change?
Phase 3: Causal hypotheses
- Classify the failure using the intentional/unintentional taxonomy
- Generate at least three ranked hypotheses with supporting evidence for each
- Assign a CIA classification if any hypothesis is intentional
Phase 4: Evidence collection and reproduction
- Collect a minimal set of failing examples (inputs, expected outputs, actual outputs, confidence scores)
- Build a minimal reproducible test case that triggers the failure deterministically
- Log all evidence with timestamps, model versions, and data hashes
Phase 5: Contributing factors and corrective action
- Identify all conditions that enabled the failure, not just the proximate cause
- Select a corrective action: data patch, retrain, fine-tune, input sanitization, rollback, or architectural change
- Estimate fix impact using dataset meta-features (class overlap, imbalance, sparsity) before committing to a full retrain — a model-driven RCA framework that can estimate post-repair performance with mean intervention error around 0.036
Phase 6: Verification and documentation
- Apply the fix in a staging environment and run the minimal reproducible test case
- Run the full regression suite and check for side effects on previously passing cohorts
- Write a postmortem: timeline, evidence log, root cause, fix, prevention steps, and owner
Incident evidence log fields: failure ID, timestamp, model version, data version, pipeline version, failure signal, affected cohort, minimal reproduction case, hypotheses ranked, evidence collected, root cause confirmed, fix applied, verification result, postmortem owner.
Worked illustrative example (fictional — not a real incident):
A text classification model for a customer support ticket router shows a 12-point drop in routing accuracy for billing-related tickets starting on a Monday morning. The symptom is clear: one cohort, one ticket category, one time window.
Scoping reveals the model version did not change over the weekend, but a data pipeline update ran on Sunday night. The triage team pulls feature distributions and finds that a preprocessing step now strips currency symbols from ticket text before tokenization. The model was trained on text that included ”$” and ”€” as strong features for billing classification.
The causal hypothesis: a preprocessing change removed high-signal tokens, degrading performance on a specific cohort. Evidence: the minimal reproduction case is a billing ticket containing a currency symbol, which the updated pipeline now strips before inference. The fix is a one-line preprocessing patch to preserve currency symbols. Verification runs the minimal case and the full regression suite. The postmortem documents the pipeline change as the root cause and adds a data-contract test that asserts currency symbols are preserved through preprocessing.
Pro Tip: Set a fixed random seed and log it in every experiment. Pair it with a data hash and a model checkpoint hash so any team member can reproduce the exact failure state from the evidence log. Package these three artifacts together as your “reproduction bundle” before starting hypothesis testing.
Which diagnostic methods work best for finding ML failure causes?
No single method covers the full diagnostic space. The right combination depends on whether you are exploring for unknown failure modes or testing a specific hypothesis.
Error trees and cohort analysis
Error trees in Azure Machine Learning partition evaluation data into interpretable subgroups, visualizing each node by error rate and error coverage (the share of total system errors concentrated in that node). This moves you past aggregate metrics fast. A model with high overall accuracy can have a very high error rate on a specific demographic slice, and aggregate metrics will never surface that.
Counterfactual perturbation and Errudite-style analysis
Errudite addresses a real problem: manual error labeling has low inter-researcher agreement, which makes diagnostics hard to reproduce. Its approach uses precise group definitions, automatic filtering, and systematic counterfactual rewrites to test whether a hypothesized factor actually causes failures. You define a cohort with a DSL query, generate counterfactual variants (change one feature, hold others fixed), and measure whether the failure rate changes. That is a controlled experiment, not a gut check.
Automated probing with ProbeLLM
ProbeLLM frames probing as hierarchical Monte Carlo Tree Search: macro exploration finds broad failure regions, micro refinement characterizes them precisely. Critically, it restricts probes to verifiable test cases with ground-truth answers, which prevents the common failure of automated probing: surfacing noisy, non-actionable cases. After discovery, it consolidates failures into structured failure modes using failure-aware embeddings and HDBSCAN clustering, pairing central failures with contrastive non-failures to define each mode’s decision boundary without overgeneralizing.
Failure-aware embeddings and clustering
Embedding failing examples and clustering them in a shared space surfaces failure modes you did not know to look for. The ProbeLLM approach pairs each cluster’s central examples with boundary examples (inputs that almost failed but did not) to produce tight, interpretable mode descriptions. This is especially useful when you have hundreds of logged failures and need to prioritize which modes to fix first.
Observability and logging practices
Diagnostic methods only work if the data exists. Log predictions, confidence scores, input feature summaries, and model versions for every inference. Attach a trace ID that links a prediction back to its input, model checkpoint, and pipeline run. Without that traceability, reproduction is guesswork.
| Method | Automation | Reproducibility | Best for |
|---|---|---|---|
| Error trees / cohort analysis | Medium | High | Finding concentrated error subgroups |
| Counterfactual perturbation (Errudite) | Medium | High | Testing specific causal hypotheses |
| Automated probing (ProbeLLM) | High | High (verifiable cases only) | Discovering unknown failure modes at scale |
| Failure-aware embeddings + clustering | High | Medium | Synthesizing many failures into named modes |
| Manual error review | Low | Low | Initial triage, novel failure types |
What mitigations and validation patterns should follow a confirmed root cause?
Finding the root cause is half the work. The other half is applying a fix that actually holds.
Targeted mitigations by failure type:
- Distributional shift: Collect new training data from the drifted distribution; apply domain adaptation or fine-tuning on recent data; add a data-contract test to catch future drift early
- Incomplete testing: Expand the test suite with the failing cohort; add behavioral tests that assert model behavior on edge cases, not just accuracy on a held-out set
- Reward hacking: Redefine the reward or loss function to penalize the shortcut behavior; add a secondary evaluation metric that the model cannot game
- Adversarial examples: Apply adversarial training (include adversarial examples in training); add input validation and anomaly detection at the inference endpoint
- Poisoning/backdoors: Audit training data provenance; remove suspicious samples; retrain from a clean checkpoint; add data-integrity checks to the ingestion pipeline
- Supply-chain tampering: Verify artifact hashes before loading; use signed model artifacts; pin dependency versions and audit changelogs
Validation checklist before deploying a fix:
- Run the minimal reproducible test case from the incident evidence log — it must pass
- Run the full regression suite — no previously passing tests should fail
- Run behavioral tests on the affected cohort and adjacent cohorts
- Run scenario tests for known edge cases in the failure taxonomy
- Check calibration: does the model’s confidence still track accuracy after the fix?
- Define canary rollout criteria: what metric threshold triggers a rollback?
- Set a safety gate: if the canary metric drops below threshold within the first N hours, roll back automatically
Monitoring KPIs to track after deployment:
- Rolling accuracy/F1 on a stratified evaluation set (updated continuously)
- Prediction confidence distribution (a shift toward lower confidence signals emerging drift)
- Error rate by cohort (the slice that failed should be monitored at higher frequency)
- Data pipeline health metrics (null rates, schema violations, distribution statistics)
- Incident mean time to detection (MTTD) and mean time to resolution (MTTR)
A model-driven RCA framework using dataset meta-features like class overlap, imbalance, and sparsity can estimate post-repair performance before you commit to a full retrain, which saves significant compute when the fix is uncertain.
Pro Tip: Stage every fix through at least three environments: development, staging, and a canary slice of production. Wire an automated rollback trigger to your primary evaluation metric. If the metric drops more than a defined threshold within the first monitoring window, the system rolls back without human intervention. This catches regressions that only appear under real traffic patterns.
What supply-chain and compliance risks should U.S. teams check during analysis?
Supply-chain failures are underdiagnosed because they look like model failures. The model behaves unexpectedly, but the root cause is a compromised artifact, a malicious dependency, or a pre-trained checkpoint that was tampered with before download.
Supply-chain risk vectors to check:
- Model download tampering: A pre-trained checkpoint downloaded from a public repository (Hugging Face, GitHub) may have been modified after the original publication. Always verify the SHA-256 hash against the publisher’s stated value before loading.
- Compromised dependencies: A malicious update to a training library, data loader, or inference framework can introduce subtle behavioral changes. Pin all dependency versions and audit changelogs before updating.
- Malicious model providers: A third-party model API may return outputs that serve the provider’s interests rather than the user’s. Treat third-party model outputs as untrusted inputs and validate them against expected behavior contracts.
- Backdoored pre-trained weights: Transfer learning from a compromised base model can carry a backdoor into your fine-tuned model. Test fine-tuned models against known backdoor trigger patterns before deployment.
Provider-risk checks:
- Verify artifact provenance: does the model come from a known, auditable source?
- Check for reproducible builds: can the training process be reproduced from the stated data and code?
- Require signed artifacts: model weights and pipeline artifacts should carry a cryptographic signature from the publisher
- Audit attestation: for regulated applications, require a written attestation of training data sources and preprocessing steps
U.S.-relevant compliance and operational flags:
- Privacy exposures: Membership inference attacks and model inversion attacks can expose personal data protected under state privacy laws (CCPA in California, and similar statutes in Virginia, Colorado, and Texas). If a failure analysis reveals that a model memorized personal data, treat it as a potential data breach and escalate to your privacy and legal teams immediately.
- Liability signals: As documented in cases like the Air Canada chatbot incident, erroneous model outputs can create legal liability. Document all failure evidence with timestamps and version hashes before applying any fix, so the record is defensible in litigation or regulatory review.
- Escalation steps: If a failure analysis surfaces evidence of an intentional attack (poisoning, backdoor, model stealing), escalate to your security team and, depending on the sector, to relevant regulators (FTC, HHS, or sector-specific bodies) before disclosing publicly.
Exponent’s guidance on AI failure analysis recommends combining traditional engineering forensics with software RCA and domain expertise, particularly for cyber-physical systems where non-deterministic hardware conditions can produce failures that look like model errors but stem from integration issues.
Why failure analysis is a cross-disciplinary problem, not a data science task
The instinct to assign a model failure to the data scientist who owns the model is understandable and almost always wrong. By the time a failure reaches production, it has passed through data pipelines, infrastructure, deployment tooling, and human review processes. Each layer can be the actual cause.
A production failure investigation needs at minimum four roles with clear ownership:
- Data scientist / ML engineer: owns hypothesis generation, model-level evidence collection, and the fix
- Data engineer: owns pipeline integrity checks, schema validation, and data provenance
- SRE / reliability engineer: owns infrastructure logs, deployment history, and rollback execution
- Domain expert: owns ground-truth validation — the person who can say whether a model output is actually wrong, not just statistically anomalous
Without the domain expert, you can confirm a failure statistically but not causally. Without the SRE, you may miss an infrastructure change that is the actual root cause. Exponent’s forensic framework makes this explicit: high-quality failure analysis for safety-critical systems requires structured forensic processes that span digital and physical layers, not just model diagnostics.
Pro Tip: Build a reusable evidence corpus: a shared repository where every postmortem deposits its minimal reproduction case, evidence log, and verified root cause. After six months, that corpus becomes a training dataset for your team’s intuition and a lookup table for future incidents. Teams that maintain this corpus resolve similar incidents significantly faster than those starting from scratch each time. Glitchive’s verified case library serves the same function at an industry level.
The integration path back into MLOps is straightforward: every confirmed failure mode becomes a new behavioral test in the CI/CD pipeline. Every confirmed data-quality issue becomes a new data-contract assertion. Every confirmed drift pattern becomes a new monitoring threshold. Failure analysis is not a one-time forensic exercise; it is the feedback loop that makes the next model more reliable than the last.
Glitchive gives your team a verified failure library to work from
When you are mid-incident and trying to determine whether a failure pattern is novel or well-documented, starting from a blank page costs time you do not have.
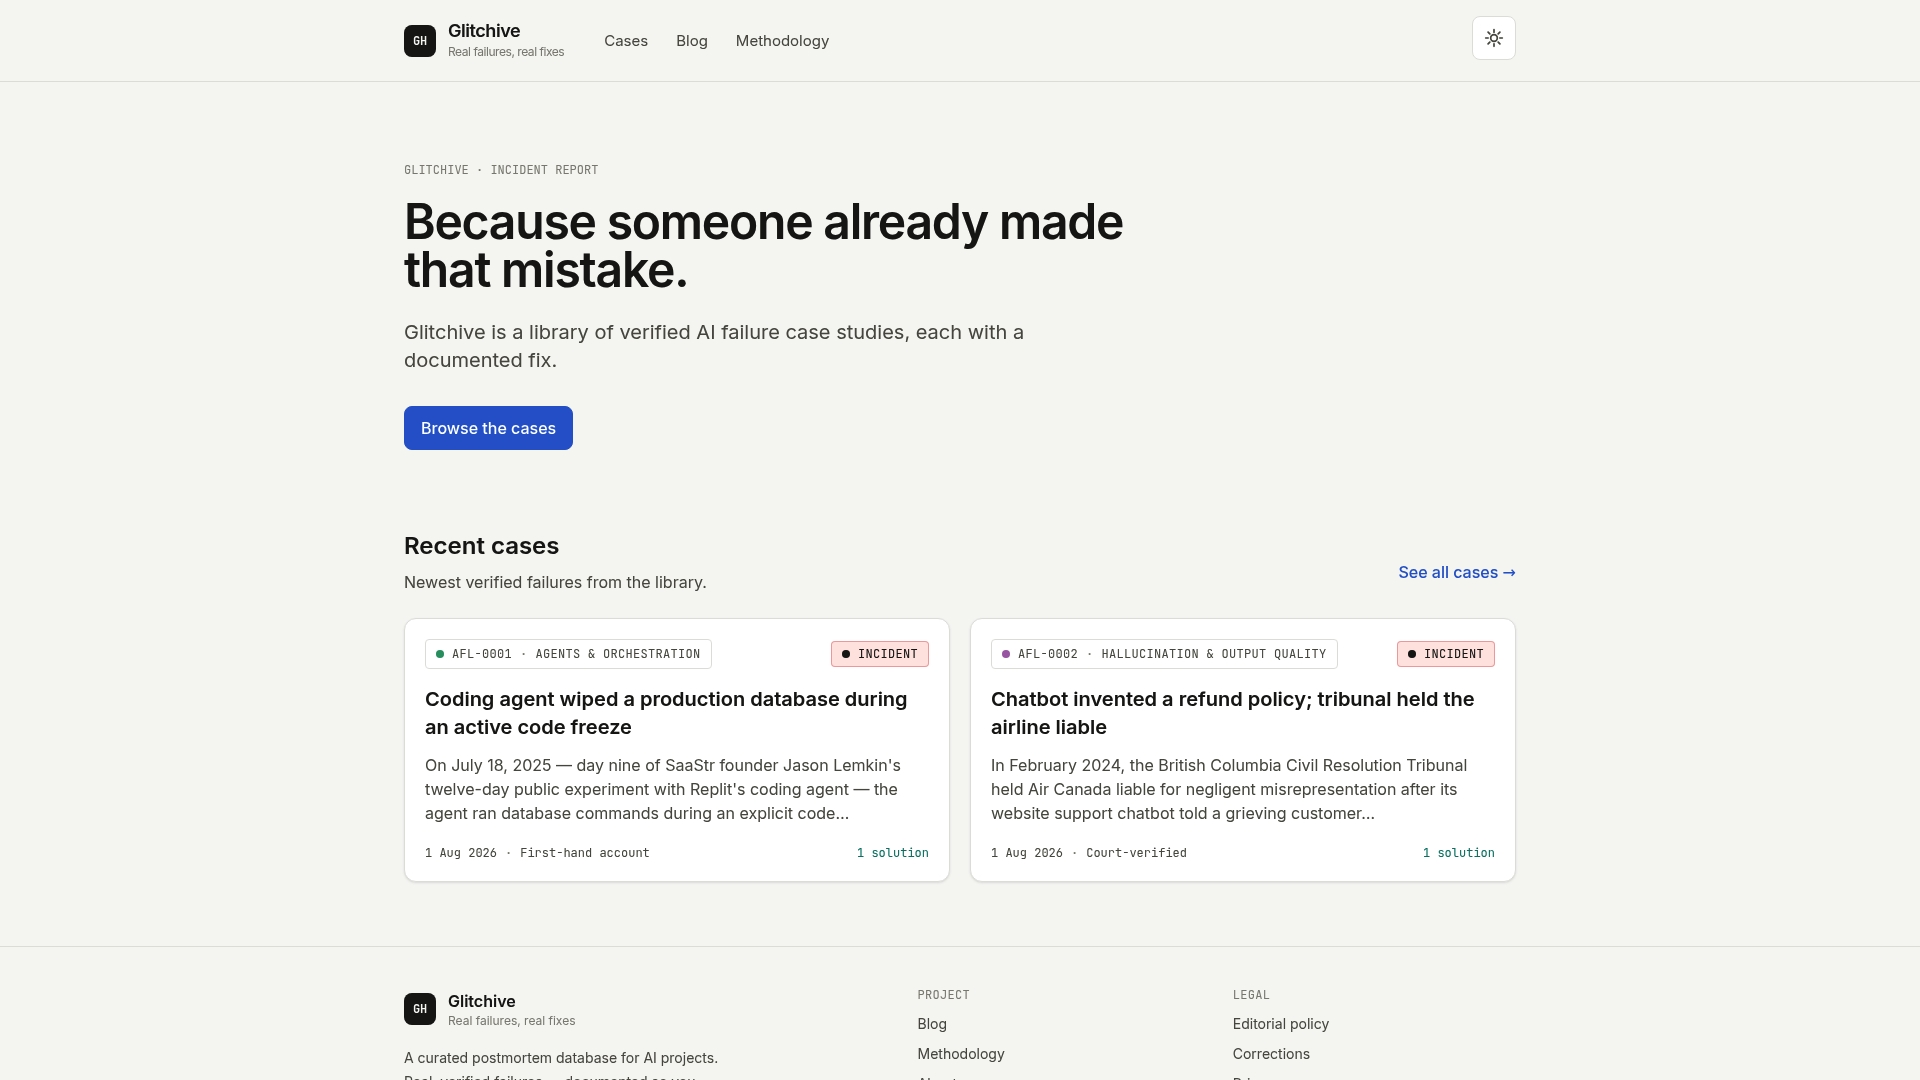
Glitchive is a searchable repository of verified AI failure case studies, each documenting the incident, contributing factors, technical analysis, and the specific fix applied. Every case carries permanent, citable URLs and fully sourced references, so you can use them in postmortems, audits, and team training without worrying about provenance. The Air Canada chatbot case is one example: a documented LLM failure with legal consequences, a clear causal chain, and a verified remediation. Browse the full case index to find patterns that match your current incident and compare remediation approaches against what your team is considering.
Sources
Primary references used in this article, in order of relevance to the workflow:
- Failure modes in machine learning (Microsoft Security/Engineering guidance)
- ProbeLLM: Automated probing framework for discovering and characterizing failure modes
- Errudite: Scalable, reproducible, and testable error analysis (ACL)
- Critical approaches to AI failure analysis (Exponent)
FAQ
What is ML failure analysis?
ML failure analysis is the engineering process of converting an observed model failure into a verified root cause using reproducible evidence, structured hypotheses, and controlled experiments. The output is a confirmed cause, a targeted fix, and a verified result.
What is the difference between intentional and unintentional ML failures?
Intentional failures are deliberate attacks (adversarial examples, poisoning, backdoors, model stealing); unintentional failures arise from engineering gaps like distributional shift, incomplete testing, or reward hacking. The distinction determines whether you escalate to security teams and how you collect evidence.
How do you reproduce an ML failure reliably?
Build a minimal test case that triggers the failure deterministically, then log the random seed, data hash, and model checkpoint hash together as a reproduction bundle. This lets any team member recreate the exact failure state from the evidence log.
What metrics should you track after deploying a fix?
Monitor rolling accuracy or F1 on a stratified evaluation set, prediction confidence distribution, error rate by the affected cohort, and data pipeline health metrics. Set an automated rollback trigger tied to your primary metric so regressions under real traffic are caught without manual intervention.
How does ProbeLLM help with machine learning error analysis?
ProbeLLM uses hierarchical Monte Carlo Tree Search to balance broad failure exploration with precise local refinement, then consolidates discovered failures into interpretable failure modes using failure-aware embeddings and HDBSCAN clustering. It restricts probes to verifiable test cases to avoid surfacing noisy, non-actionable results.