On this page

A practical AI risk taxonomy classifies every incident along five axes — lifecycle stage, failure mechanism, harm type, affected party, and control gap — and maps each classification to a NIST AI RMF function so your team knows exactly what to do next. Start using it in three steps:
- Identify the incident: pull the raw event from your incident log, postmortem, or case library.
- Classify along the five axes: assign a value to each dimension (for example, “deployment” / “hallucination” / “legal harm” / “end user” / “output validation gap”).
- Map to a NIST function: route control gaps to GOVERN, context gaps to MAP, measurement needs to MEASURE, and active mitigations to MANAGE.
The rest of this guide unpacks each axis, shows how to map classifications to established frameworks, walks through a worked example, and gives you a step-by-step playbook for building and maintaining the taxonomy inside your organization.
Key Takeaways
A practical AI risk taxonomy separates lifecycle stage, failure mechanism, harm type, affected party, and control gap, then maps each classification to a NIST AI RMF function to drive specific organizational action.
| Point | Details |
|---|---|
| Five axes, not one label | Classify every incident across lifecycle stage, failure mechanism, harm type, affected party, and control gap separately. |
| NIST mapping converts labels to actions | Control gaps route to GOVERN; lifecycle stage to MAP; failure mechanisms to MEASURE; harm type to MANAGE. |
| Start with a pilot of 10 incidents | Run two independent classifiers and target a Cohen’s kappa of 0.7 before broader rollout. |
| Taxonomies are living artifacts | NIST and MIT both emphasize that context of use determines severity; review the taxonomy at least every six months. |
| Glitchive for evidence | Glitchive’s verified case library provides citable, structured incidents to seed categories and calibrate classifiers. |
Table of Contents
- What an AI risk taxonomy is and why your organization needs one
- The five core dimensions of a practical AI risk taxonomy
- How to map your classifications to NIST AI RMF and other frameworks
- How to build, adopt, and operationalize the taxonomy in your organization
- A worked example: classifying a verified failure and selecting mitigations
- Common classification mistakes teams make and how to avoid them
- How taxonomies are developed and validated
- The hardest part of taxonomy adoption is not the taxonomy
- Glitchive gives your taxonomy real evidence to work with
- Sources
- FAQ
What an AI risk taxonomy is and why your organization needs one
A taxonomy of AI risks is a structured classification system, not a universal truth. It gives your teams a shared vocabulary to label incidents consistently, trace failure patterns, and route findings to the people who can act on them. Without one, a privacy incident in a healthcare deployment might be logged as a “model error” by one team and a “compliance gap” by another — producing data that is useless for trend analysis or governance reporting.
The practical benefits for decision-makers are concrete:
- Consistent incident classification across teams, products, and deployment contexts.
- Prioritized mitigation by mapping harm severity and affected-party scope to response urgency.
- Clearer governance reporting that connects technical failures to board-level risk categories.
- Improved cross-team communication by eliminating the terminological diversity that MIT’s AI Risk Initiative identifies as a persistent barrier to coordinated response.
- Audit-ready evidence trails that regulators and external reviewers can follow.
One caveat worth stating plainly: NIST’s AI RMF is explicit that context of use determines how risks should be categorized and prioritized. A hallucination in a low-stakes content tool carries a different severity than the same failure in a clinical decision-support system. Taxonomies are living artifacts — they need to be updated as deployment contexts evolve, not treated as fixed reference tables.
The MIT AI Risk Repository currently tracks over 1,700 classified AI risks across a causal taxonomy (how risks arise) and a domain taxonomy (what harms they produce), spanning 7 domains and 24 subdomains. That scale illustrates why a structured classification system matters: without axes and categories, 1,700 risks are just a list.
The five core dimensions of a practical AI risk taxonomy
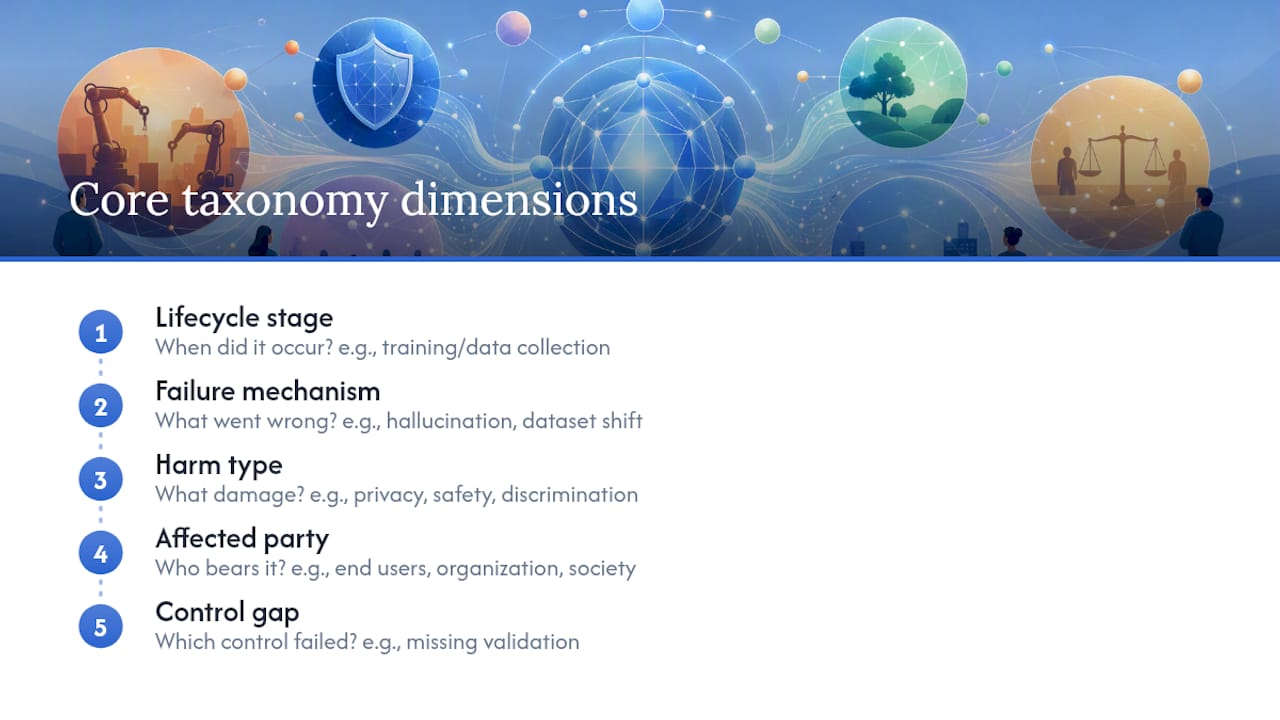
Each dimension answers a different question about an incident. Keeping them separate is what makes the taxonomy useful — conflating them is the most common mistake teams make (more on that in a later section).
1. Lifecycle stage — When in the AI system’s life did the risk materialize?
Stages run from design and data collection through training, evaluation, deployment, operation, and decommissioning. A failure at the training stage (for example, a biased dataset) requires a different fix than a failure at the operation stage (for example, a model receiving out-of-distribution inputs). Record the stage where the causal factor first appeared, not where the harm became visible.
Example: A language model trained on data scraped before a regulatory change produces outputs that are now legally non-compliant. The lifecycle stage is training (data collection), even though the harm surfaces during operation.
2. Failure mechanism — What went wrong technically or behaviorally?
This is the causal engine of the incident: dataset shift, reward hacking, hallucination, prompt injection, adversarial attack, specification gaming, or distributional mismatch, among others. This axis is where your engineering team will spend most of their diagnostic time.
Example: A retrieval-augmented generation system returns a confident, fabricated citation because the retriever found no relevant document and the generator filled the gap. Failure mechanism: hallucination under retrieval failure.
3. Harm type — What category of damage resulted or could result?
Harm types include privacy violations, physical safety risks, financial loss, reputational damage, legal liability, fairness and discrimination harms, and broader societal harms. One incident can produce multiple harm types; record all of them, ranked by severity.
Example: A credit-scoring model trained on historically biased data denies loans at higher rates to a protected demographic. Harm type: discrimination / fairness harm with secondary financial harm to affected individuals.
4. Affected party — Who bears the risk?
Affected parties range from individual end users and specific demographic groups to the deploying organization, third-party contractors, and society at large. Specifying the affected party determines which regulatory obligations apply and which stakeholders must be notified.
Example: A customer-service chatbot fabricates a refund policy. The affected party is the end user (who relied on the false policy) and the organization (which faces legal liability).
5. Control gap — What governance, engineering, or operational control was absent or failed?
Control gaps point directly to remediation categories: missing output validation, absent human-in-the-loop review, inadequate red-teaming, no adversarial testing, weak access controls, or absent monitoring and alerting. This axis is what converts a classification into a work order.
Example: The chatbot case above had no output-grounding check against a verified policy document. Control gap: output validation / grounding.
Metadata to capture alongside axis values: model type and version, deployment context (internal tool vs. public-facing product), confidence level of the classification, evidence links (postmortem URL, case ID, log reference), and the classifier’s name for inter-rater tracking.
Pro Tip: Separate causal factors from domain labels before you start classifying. Dataset shift is a failure mechanism (why the system failed). Privacy is a harm type (what damage resulted). Mixing them on the same axis produces classifications that point nowhere — you cannot design a control for “privacy dataset shift” because it conflates the cause and the consequence.
How to map your classifications to NIST AI RMF and other frameworks
The NIST AI RMF 1.0 organizes AI risk management into four functions: GOVERN, MAP, MEASURE, and MANAGE. Each taxonomy axis maps naturally to one or more of these functions, which means a completed classification doubles as a routing table for organizational action.
| Taxonomy axis (sample value) | NIST function triggered | Example mitigation / control category |
|---|---|---|
| Control gap (output validation absent) | GOVERN | Establish output-review policy; assign accountable owner |
| Lifecycle stage (training / data collection) | MAP | Document data provenance; assess context-of-use constraints |
| Failure mechanism (hallucination) | MEASURE | Run factuality benchmarks; set detection thresholds |
| Harm type (legal liability) | MANAGE | Activate legal review; notify affected users; patch deployment |
| Affected party (protected demographic group) | GOVERN + MAP | Trigger bias audit; update impact assessment |
The logic behind the mapping: GOVERN handles structural accountability — policies, roles, and oversight processes — so control gaps and affected-party scope route there first. MAP establishes the context in which a risk exists, so lifecycle stage and deployment context feed MAP. MEASURE selects the tests and metrics that confirm whether a failure mechanism is present or resolved, so failure mechanism drives MEASURE. MANAGE executes the response, so harm type and severity determine the urgency and nature of MANAGE actions.
Crosswalks to MIT and academic taxonomies:
The MIT AI Risk Repository and its AI Risk Navigator cross-reference 13+ frameworks, making it a practical starting point for seeding your own taxonomy categories. The repository’s causal taxonomy maps closely to the failure mechanism axis; its domain taxonomy maps to harm type. The AIR 2024 taxonomy organizes risks into four level-1 categories with hundreds of granular subtypes derived from government regulations and company policies — useful for checking whether your control gap categories align with what regulators actually require.
A governance-focused integrative framework published through the MIT AI Risk Initiative proposes a layered approach that links risk categories to specific public-sector governance steps — worth consulting if your organization operates in a regulated environment and needs to tie taxonomy outputs to formal governance processes.
How to build, adopt, and operationalize the taxonomy in your organization
Building a taxonomy is a project, not a meeting. The steps below are sequential; skipping the pilot phase is the most common reason taxonomies get abandoned after six months.
-
Scope the taxonomy. Define which AI systems, deployment contexts, and incident types are in scope. A taxonomy that tries to cover everything from the start covers nothing well. Start with the highest-risk deployment or the domain where incidents are most frequent.
-
Collect evidence. Pull 20–30 recent incidents, postmortems, or near-misses. If your organization lacks documented cases, seed the taxonomy using the MIT AI Risk Repository or Glitchive’s verified case library as reference material.
-
Draft axis definitions and value lists. Write one-sentence definitions for each axis value (for example, “hallucination: the model generates a confident assertion not grounded in its input or retrieval context”). Include at least one example per value.
-
Run a pilot with 10 incidents. Have two independent classifiers label the same 10 incidents. Measure inter-rater agreement. A Cohen’s kappa below 0.6 signals that axis definitions need tightening before broader rollout.
-
Crosswalk to NIST AI RMF. Map each axis value to the NIST function it triggers (use the table in the previous section as a starting template). This step is what converts the taxonomy from a labeling exercise into a governance tool.
-
Integrate into your incident schema. Add taxonomy fields to your ticketing system (Jira, ServiceNow, or equivalent). Automate alerts: when a ticket is tagged with a specific failure mechanism and harm type combination, route it to the designated owner.
-
Train the team. Run a 90-minute workshop using real incidents. Calibration exercises — where participants classify the same case independently and then compare — build inter-rater reliability faster than any written guide.
-
Set a review cadence. Review the taxonomy quarterly for the first year. Add new axis values when three or more incidents cannot be classified with existing labels. Archive deprecated values rather than deleting them, so historical data remains interpretable.
Operational checklist for adoption:
- Assign a taxonomy owner (typically the AI risk or governance lead).
- Define the incident tagging convention in writing and store it in your team wiki.
- Link each taxonomy label to a NIST function in your documentation.
- Establish a corrections process for reclassifying incidents when new evidence emerges.
- Schedule a quarterly review with at least one stakeholder from legal, engineering, and product.
KPIs to track:
- Classification coverage: percentage of logged AI incidents with all five axes populated.
- Inter-rater agreement: Cohen’s kappa across independent classifiers, target 0.7 or above.
- Time-to-mitigate by risk category: track whether specific failure mechanisms consistently take longer to resolve.
- Detection lead time: how early in the lifecycle a risk is identified relative to when harm occurs.
A worked example: classifying a verified failure and selecting mitigations
The following example draws from a verified Glitchive case. A support chatbot at an airline fabricated a refund policy that did not exist, a passenger relied on it, and a civil resolution tribunal subsequently held the airline liable for the chatbot’s output.
This is a real documented incident; the taxonomy classification below is illustrative, showing how the five-axis framework applies to the verified facts.
| Taxonomy axis | Value for this incident |
|---|---|
| Lifecycle stage | Deployment / operation |
| Failure mechanism | Hallucination (policy fabrication under open-ended query) |
| Harm type | Legal liability; financial harm to end user |
| Affected party | Individual end user; deploying organization |
| Control gap | No output grounding against verified policy documents; no human-in-the-loop escalation for policy queries |
Remediation checklist mapped to NIST functions:
- GOVERN: Assign an accountable owner for chatbot policy-response outputs. Establish a written policy prohibiting the chatbot from answering questions about refund eligibility without a verified source citation.
- MAP: Document the deployment context: public-facing customer service, high-stakes queries (financial commitments), no prior impact assessment for policy-fabrication scenarios.
- MEASURE: Run a factuality evaluation suite against the chatbot’s policy-response outputs. Set a threshold: any response referencing a specific policy must include a grounded citation. Track false-policy-assertion rate weekly.
- MANAGE: Implement retrieval-augmented generation grounded strictly in the verified policy document. Add a fallback response (“I can’t confirm that policy — please contact our support team directly”) for queries where no grounded answer exists. Notify legal of the tribunal finding and audit similar deployments.
The Glitchive case page includes the full incident record, contributing factors, and documented fix with source citations — the kind of evidence trail that makes inter-rater calibration exercises concrete rather than hypothetical.
Common classification mistakes teams make and how to avoid them
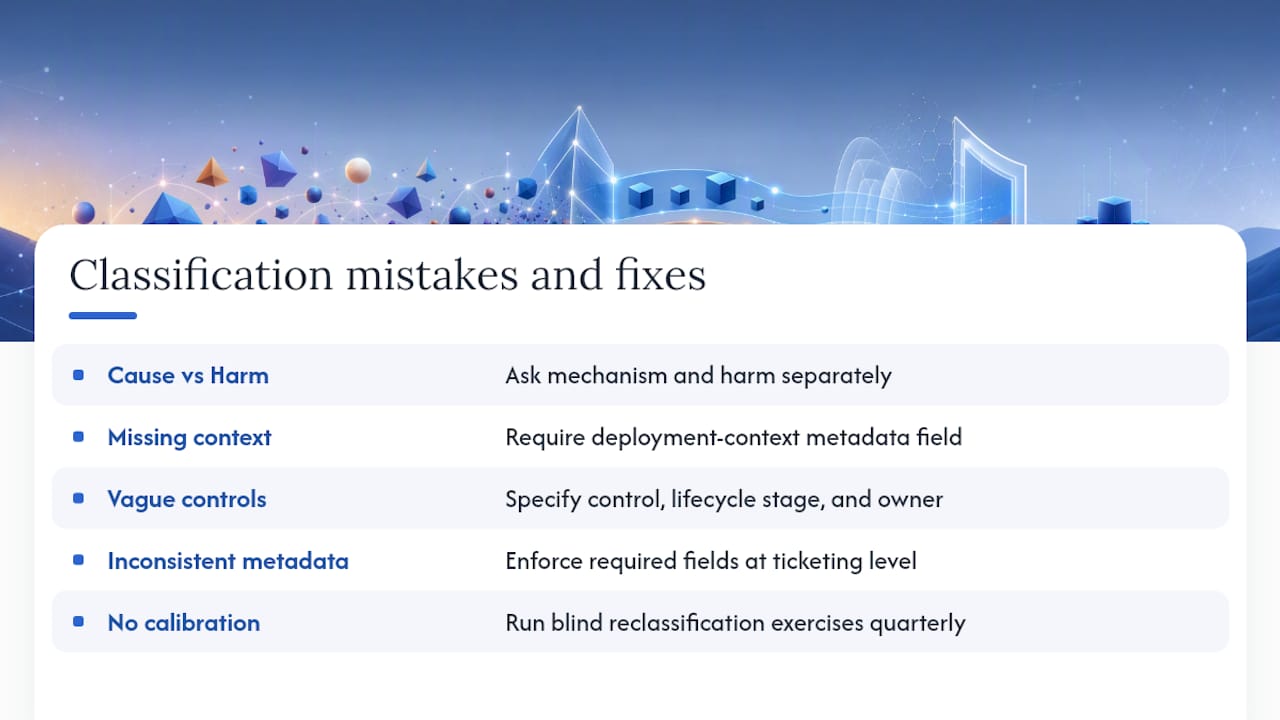
Conflating causal factor with harm domain. The most frequent error: labeling an incident “privacy failure” when the actual mechanism is dataset shift that exposed personal data. Privacy is the harm; dataset shift is the cause. Mixing them on the same axis produces a classification that cannot drive a specific engineering fix.
Countermeasure: Before assigning any label, ask two questions separately: “What went wrong technically?” (mechanism axis) and “What damage resulted?” (harm axis). If the answer to both is the same phrase, you have conflated them.
Failing to capture context of use. A classification that omits deployment context — who is using the system, in what environment, with what stakes — cannot be mapped to NIST’s MAP function accurately. The NIST AI RMF is explicit: severity is a function of socio-technical context, not an intrinsic model property.
Countermeasure: Add a mandatory “deployment context” metadata field to every incident record. Require classifiers to fill it before submitting.
Under-specifying control gaps. Writing “insufficient testing” as a control gap is nearly useless. It does not point to a specific engineering action, a team, or a NIST function. “No adversarial prompt testing for policy-query inputs prior to deployment” is specific enough to become a work order.
Countermeasure: Require control gap values to answer three sub-questions: what control was missing, at what lifecycle stage, and who owns the remediation.
Inconsistent metadata across incidents. When model version, deployment date, and evidence links are missing from half the incident records, trend analysis becomes impossible. You cannot determine whether a specific model version is responsible for a cluster of hallucination incidents if version data is absent.
Countermeasure: Enforce required fields at the ticketing level. Make it impossible to close an incident ticket without populating all five axis fields and the core metadata fields.
Skipping inter-rater calibration. A taxonomy that one person understands and ten people apply differently is not a taxonomy — it is a personal filing system. Without calibration, classification coverage metrics are meaningless.
Countermeasure: Run blind reclassification exercises quarterly. Present three incidents to all classifiers independently, compare results, and update axis definitions wherever agreement falls below your kappa threshold.
Pro Tip: Keep an evidence ledger alongside your taxonomy: for every label decision that required judgment, record the reasoning and the evidence that supported it. When an auditor or a new team member questions a classification six months later, the ledger makes the decision traceable. Without it, you are relying on memory.
How taxonomies are developed and validated
Bottom-up vs. top-down: the practical tradeoff
A bottom-up taxonomy starts from labeled, real-world incidents and derives categories from patterns in the evidence. The AIR 2024 taxonomy demonstrates this approach: its four level-1 categories and hundreds of granular subtypes were derived from actual government regulations and company policies, not from a theoretical framework imposed in advance. Bottom-up taxonomies tend to produce categories that engineering teams can act on, because the categories reflect how failures actually present.
A top-down taxonomy starts from a policy framework or regulatory structure and works downward to specific risk types. The advantage is alignment with governance requirements from day one; the disadvantage is that categories may not map cleanly to the failure mechanisms your engineering team encounters. The Slattery et al. meta-review, which organized over 1,600 distinct risks across major AI risk frameworks, found that evidence-driven approaches produce more operationally useful categories for practitioners.
Most organizations benefit from a hybrid: start top-down to satisfy governance and regulatory requirements, then refine bottom-up using real incident data.
Validation checklist:
- Pilot labeling: classify 20–30 incidents before finalizing any axis definitions.
- Inter-rater agreement: target a Cohen’s kappa of 0.7 or above across two independent classifiers. Below 0.6, revise definitions before proceeding.
- Coverage test: verify that at least 90% of your existing incident backlog can be classified without creating new categories. If more than 10% require new labels, your axis definitions are too narrow.
- Lifecycle re-review: schedule a full taxonomy review every six months for the first two years, then annually once the taxonomy stabilizes.
- Stakeholder sign-off: require sign-off from legal, engineering, and governance leads before publishing the taxonomy internally. This is not bureaucracy — it is what makes the taxonomy usable across silos.
Documenting methodology for auditors:
Record the development approach (bottom-up, top-down, or hybrid), the evidence sources used, the date of each major revision, and the rationale for adding or retiring categories. External auditors and regulators need to trace how the taxonomy evolved — a version-controlled document in your team wiki, with dated change logs, satisfies this requirement without significant overhead.
The hardest part of taxonomy adoption is not the taxonomy
The classification framework is the easy part. The friction comes from organizational behavior: teams that log incidents inconsistently, engineers who see taxonomy tagging as overhead, and governance leads who want a report format that does not match the taxonomy’s output structure.
The most effective countermeasure is to start small and make the taxonomy unavoidable in one workflow before expanding it. Pick one domain — say, customer-facing LLM deployments — assign one owner, and require taxonomy classification in every weekly incident review for 30 days. By the end of that period, the vocabulary becomes habitual. Expanding to a second domain is then a training exercise, not a culture change.
Glitchive’s case library is built on exactly this principle: every documented failure includes the incident, the contributing factors, the technical analysis, and the specific fix, all in a citable, permanent record. That structure is what makes the cases useful for inter-rater calibration and for seeding taxonomy categories with real evidence rather than hypothetical scenarios.
Glitchive gives your taxonomy real evidence to work with
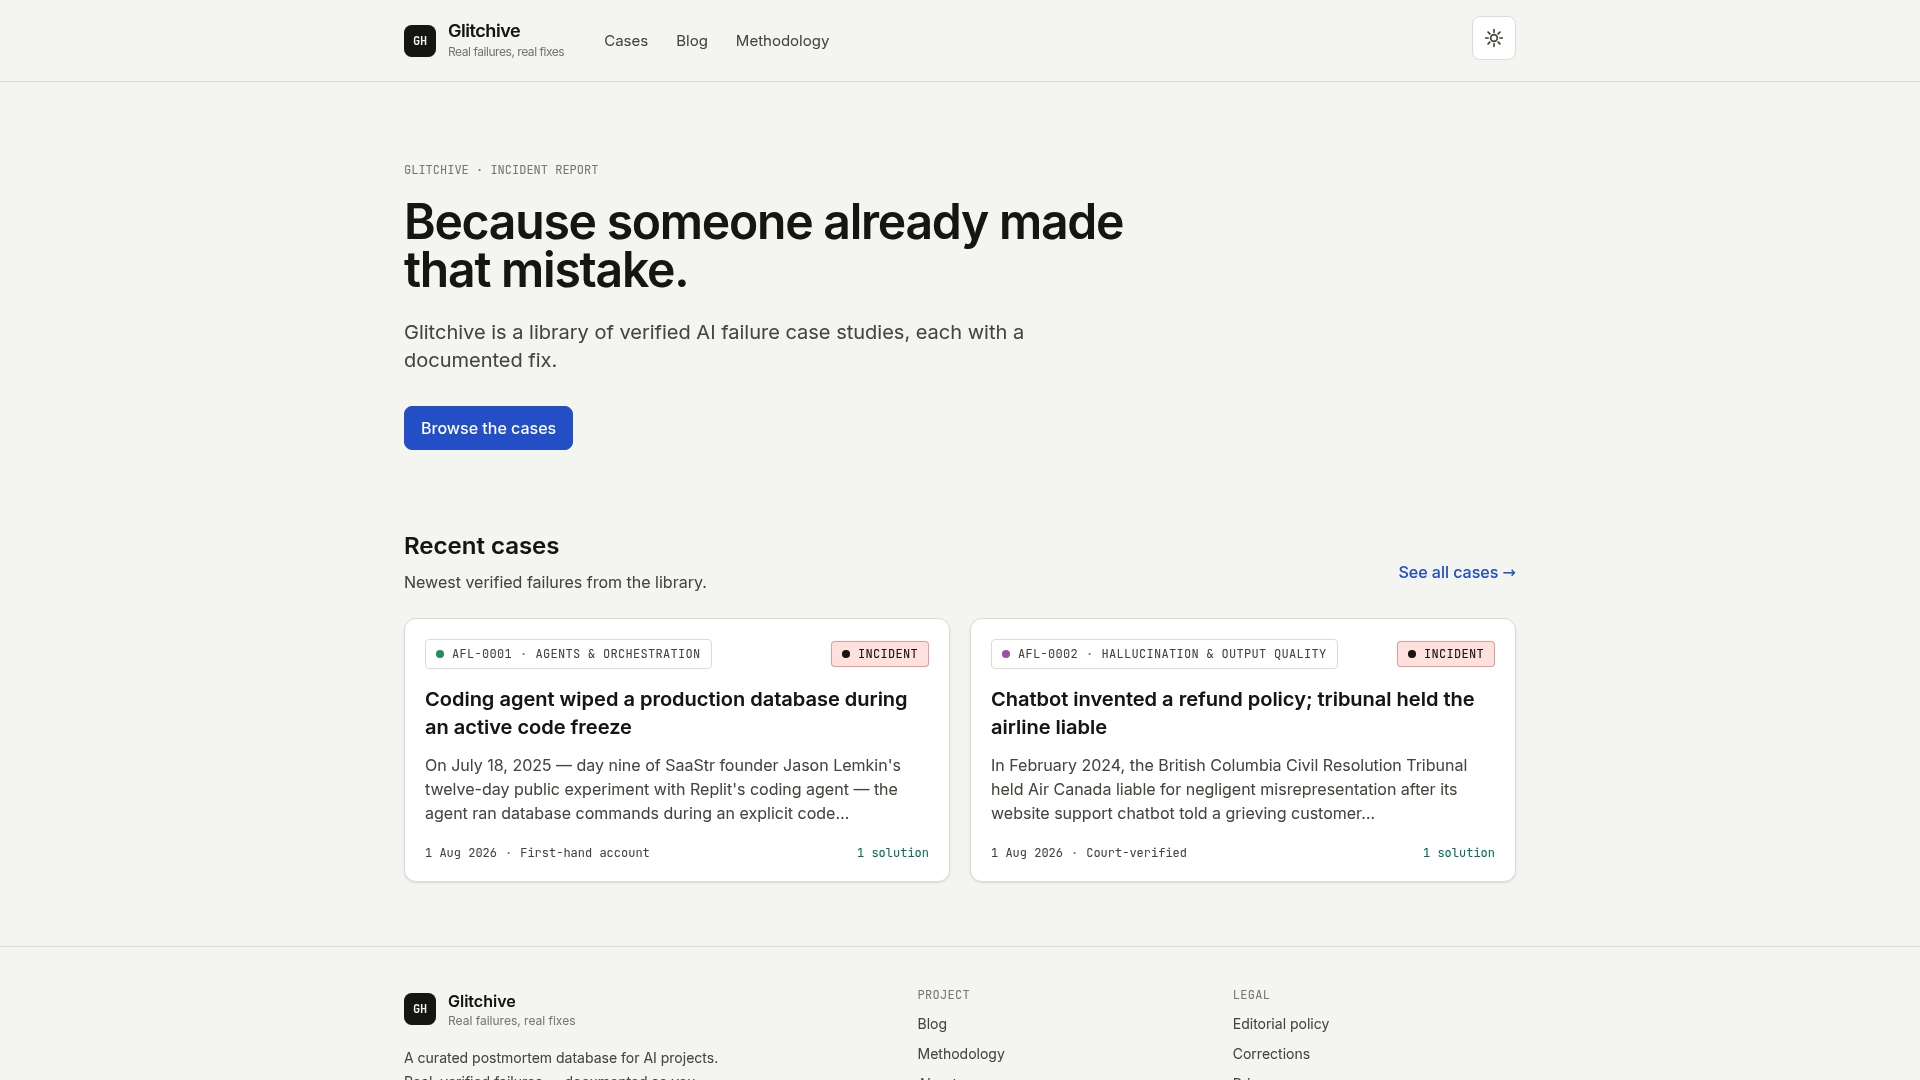
Building a taxonomy is straightforward. Populating it with credible, verified evidence is where most teams stall. Glitchive’s searchable library of verified AI failure cases gives you documented incidents with contributing factors, technical analysis, and specific fixes — each with a permanent, citable URL. Every case is structured around the same dimensions your taxonomy uses: what failed, how, who was harmed, and what fixed it.
Teams use Glitchive to seed new taxonomy categories with real failure patterns, run inter-rater calibration exercises on documented cases, and source remediation templates mapped to specific failure mechanisms. The airline chatbot case — where a fabricated refund policy triggered legal liability — is the kind of fully sourced, outcome-documented incident that makes taxonomy training concrete. Browse the full case index to find incidents relevant to your deployment context and start classifying.
Sources
- MIT AI Risk Initiative — AI Risk Database and taxonomies
- NIST AI Risk Management Framework (AI RMF)
- Artificial Intelligence Risk Management Framework (AI RMF 1.0)
- The AI risk repository: A meta-review, database, and taxonomy of risks from artificial intelligence
FAQ
What is an AI risk taxonomy?
An AI risk taxonomy is a structured classification system that organizes AI failures and harms along defined axes — such as lifecycle stage, failure mechanism, harm type, affected party, and control gap — so teams can label incidents consistently and route them to the right controls.
How does an AI risk taxonomy map to the NIST AI RMF?
Each taxonomy axis triggers a specific NIST function: control gaps map to GOVERN, lifecycle stage and deployment context to MAP, failure mechanisms to MEASURE, and harm type and severity to MANAGE. This mapping converts a classification into a set of organizational actions.
What is the difference between a causal taxonomy and a domain taxonomy?
A causal taxonomy classifies how a risk arises (the failure mechanism and contributing factors). A domain taxonomy classifies what harm results (the impact area, such as privacy, safety, or fairness). The MIT AI Risk Repository maintains both, covering 7 domains and 24 subdomains across 1,700+ classified risks.
How often should an AI risk taxonomy be updated?
Review the taxonomy at least every six months during the first two years of use, then annually once it stabilizes. Add new categories when three or more incidents cannot be classified with existing labels, and archive deprecated values rather than deleting them.
What inter-rater agreement score should teams target?
Target a Cohen’s kappa of 0.7 or above across independent classifiers before rolling out the taxonomy broadly. A kappa below 0.6 indicates that axis definitions need revision — run blind reclassification exercises and tighten the definitions before expanding use.